ITS Professor Develops a Product Quality Improvement Control Chart
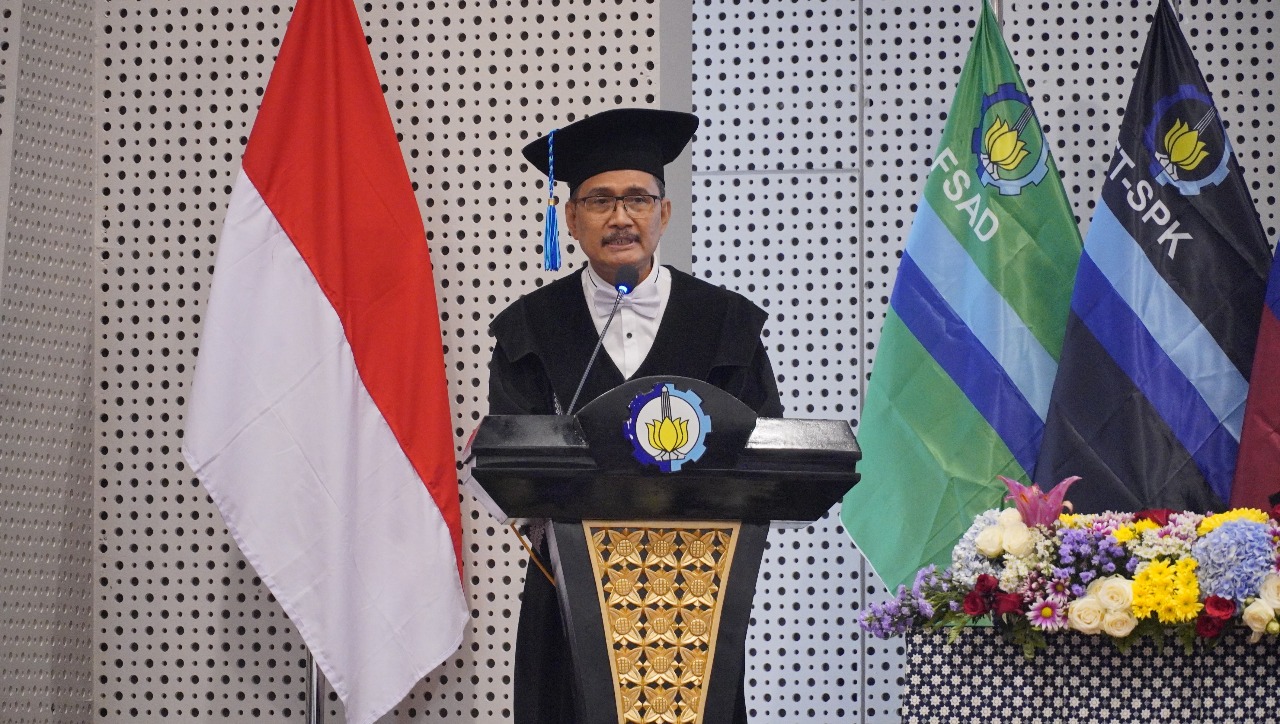
Prof Dr. Drs Muhammad Mashuri MT has been successfully inaugurated as the 149th ITS Professor from the ITS Statistics Department with a scientific oration related to product quality improvement control charts
Campus ITS, ITS News – Control charts are used to monitor process stability in improving product quality. This prompted one of the professors or professors from the Faculty of Science and Data Analytics (FSAD) of the Institut Teknologi Sepuluh Nopember (ITS) to develop a control chart so that it can be used in monitoring shifts in the variability of a product.
Through his research, Prof Dr. Drs Muhammad Mashuri MT said that the uniformity of a company’s products is one of the benchmarks that the products produced are of high quality. The more uniform a product is, the smaller the resulting variability or the higher the quality of the product.
According to the lecturer, who is familiarly called Mashuri, even though they can compete in price and service, the product will only last for a short time if it is of good quality. In addition, sales can be confirmed inconsistent. “Therefore, improving the quality of products and services is crucial for the sustainability of a company,” said Mashuri in a scientific oration delivered when he was inaugurated as a professor at the Auditorium of the ITS Research Center (RC) Building last Wednesday (12/10).
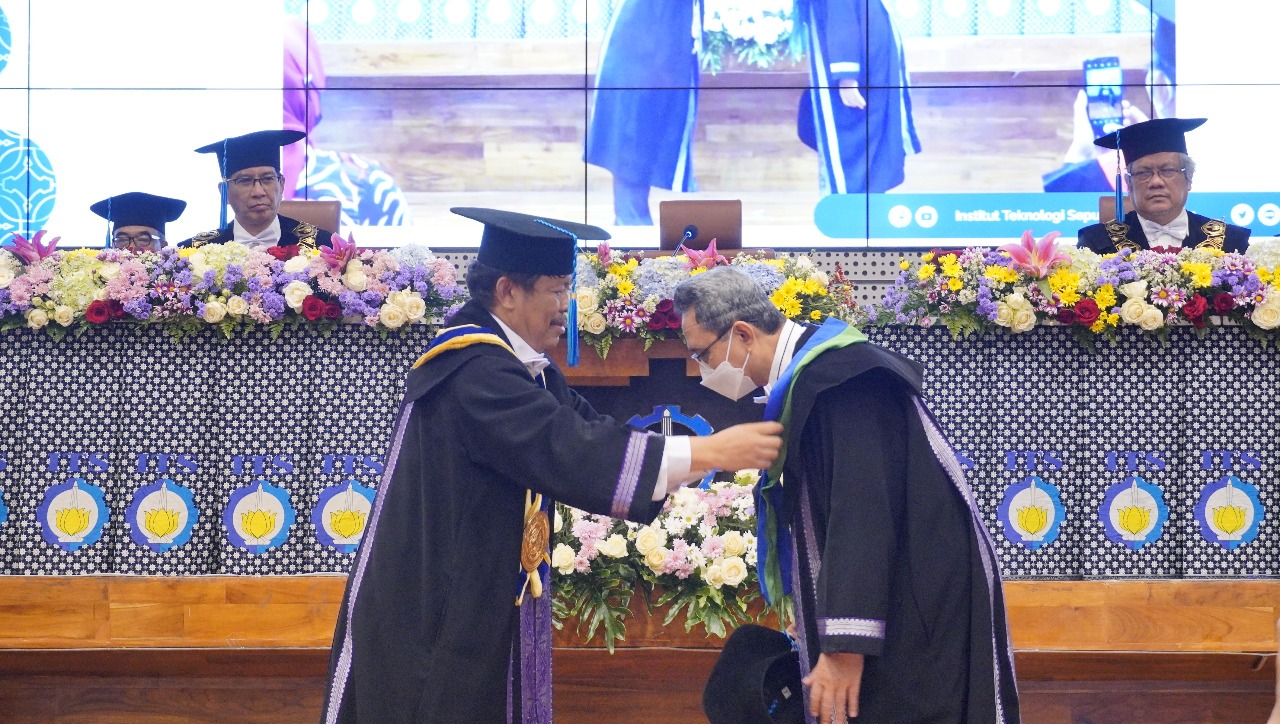
Chairman of the ITS Professors Council Prof Dr. Ir Imam Robandi MT (left) when inaugurating Prof Dr. Drs Muhammad Mashuri MT (right) as the 149th Professor of ITS
It should be noted, Mashuri developed a multivariate random variability control chart in his research. According to him, multivariate variability control charts can be grouped into three parts. Among other things, research on variability control charts for observations in the form of subgroups, individuals, and simultaneous. “Methods of controlling quality targets have undergone rapid development, but controlling variability has received less attention,” said the 149th professor of ITS.
Furthermore, this ITS Statistics Department lecturer explained the correlation between diagrams. In his explanation, the Vector Standard Deviation (VSD) control chart is helpful for monitoring shifts in subgroup variability. Meanwhile, the 𝑉𝑆D-tierda control chart is useful for monitoring shifts in individual variability. “Finally, the Tr(R2) diagram is useful in monitoring process variability for multivariate characteristics with different units and sizes,” explained the man who is also trusted as the Chairman of the ITS Manarul Ilmi Mosque Takmir.
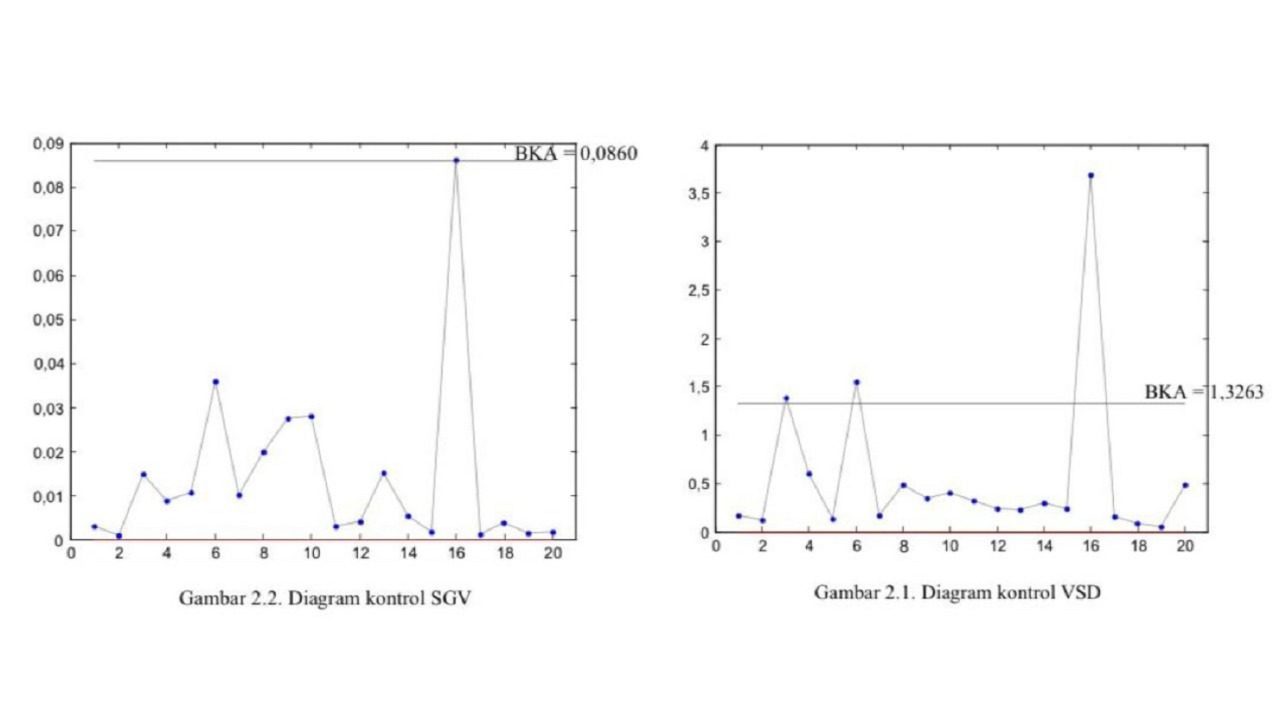
The control chart after it is developed (right) is more effective for detecting out-of-bounds observational processes than the control chart before it is developed (left)
In its development, the Mathematics doctoral alumnus of the Bandung Institute of Technology (ITB) compared that the diagrams developed were more sensitive in detecting observational processes out-of-bounds. “The results of this study are the development of various pre-existing control charts,” explained the Professor who currently serves as Deputy Chancellor II of the Kalimantan Institute of Technology (ITK).
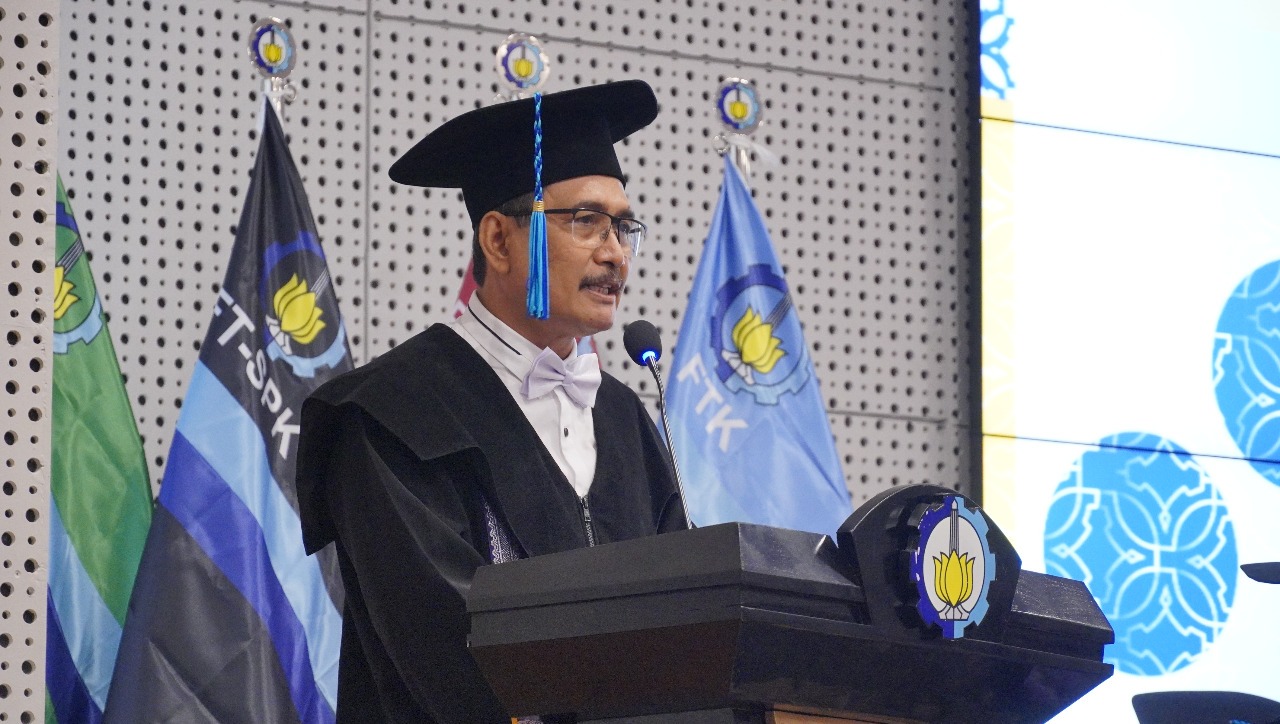
Prof Dr. Drs Muhammad Mashuri MT when delivering his scientific oration at the Professor Inauguration Ceremony in the Auditorium of the ITS Research Center Building
Based on the development that has been done, Mashuri revealed that the control chart is effective in preventing defective products. In addition, control charts can provide diagnostic and predictive information and improve product quality, goods, and services. “Quality products will increase market share while increasing market share will certainly increase company profits,” he added.
If the company’s profits increase, the dividend will also increase and potentially increase employee income to improve society’s welfare in the end. On the other hand, quality products at competitive prices can strengthen the potential of these products for export. “If the increase in product quality attracts international markets, the foreign exchange and trade surplus will also increase,” he concluded. (ITS Public Relation)
Reporter: Thariq Agfi Hermawan
Related News
-
ITS Supports Academic Infrastructure: New Medical Faculty Building
ITS Campus, ITS News — Entering the second year of accepting new students from the Faculty of Medicine and
October 13, 2022 15:10 -
ITS Welcomes 163 New Engineers to Empower Indonesia’s Growth
ITS Campus, ITS News – Institut Teknologi Sepuluh Nopember (ITS) continues its commitment to meeting the needs of engineers in
October 13, 2022 15:10 -
ITS Sends Off 12 Free Mudik Vehicles Ahead of Eid Al-Fitr
The dispatch of 11 bus fleets carrying ITS students for the Free Mudik ITS 2024 ITS Campus, ITS News
October 13, 2022 15:10 -
ITS Lecturer Wins 2024 Female Science Talents Intensive Tracks from Germany
Sri Fatmawati SSi MSc PhD, a lecturer at the Department of Chemistry, ITS, has emerged as the winner of
October 13, 2022 15:10