WCU

World Class University

An Overview

The QS World University Rankings continue to enjoy a remarkably consistent methodological framework, compiled using six simple metrics that we believe effectively capture university performance. Since faculty area normalisation was introduced in 2015 to ensure that institutions specialising in Life Sciences and Natural Sciences were not unduly advantaged, we have avoided fundamental changes. In doing so, we aim to ensure that year-on-year comparisons remain valid, and that unnecessary volatility is minimised.

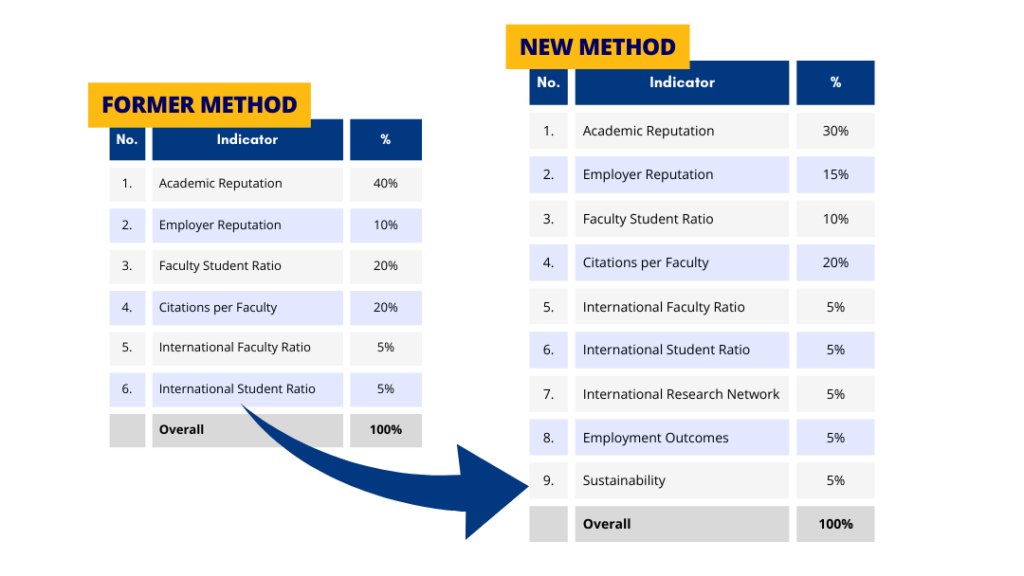
As of 2023, the QS has introduced a new methodology being used compared to the previous years. The change from the previous to the new ones lies in additional metrics. In the previous method, there are only six metrics identified: Academic Reputation, Employer Reputation, Faculty Student Ratio, Citations per Faculty, International Faculty Ratio, and International Student Ratio.

Meanwhile, the most updated method has three additional metrics: International Research Network, Employment Outcomes, and Sustainability. Therefore, nine metrics in total for the QS World University Ranking 2023 are being used. Since there are three additional metrics, it certainly affects the composition of weighting or percentage used for each component. The following figure illustrates the distinction between the former and the new methodology:

Universities continue to be evaluated according to the QS’s most-updated methodology. The in-depth description of each indicator or metric can be seen in the following:

The highest weighting of any metric is allotted to an institution’s Academic Reputation score. Based on our Academic Survey, it collates the expert opinions of over 100,000 individuals in the higher education space regarding teaching and research quality at the world’s universities. In doing so, it has grown to become the world’s largest survey of academic opinion, and, in terms of size and scope, is an unparalleled means of measuring sentiment in the academic community. As this metric has the highest percentage among others, it is worth 30% of the overall number.

Students will continue to perceive a university education as a means by which they can receive valuable preparation for the employment market. It follows that assessing how successful institutions are at providing that preparation is essential for a ranking whose primary audience is the global student community.

Our Employer Reputation metric is based on almost 50,000 responses to our QS Employer Survey, and asks employers to identify those institutions from which they source the most competent, innovative, effective graduates. The QS Employer Survey is also the world’s largest of its kind. 15% of the overall score is attributed to this metric.

Teaching quality is typically cited by students as the metric of highest importance to them when comparing institutions using a ranking. It is notoriously difficult to measure, but we have determined that measuring teacher/student ratios is the most effective proxy metric for teaching quality. It assesses the extent to which institutions are able to provide students with meaningful access to lecturers and tutors, and recognizes that a high number of faculty members per student will reduce the teaching burden on each individual academic. The overall score is composed of 10% of this metric.

Teaching is one key pillar of an institution’s mission. Another is research output. We measure institutional research quality using our Citations per Faculty metric. To calculate it, we take the total number of citations received by all papers produced by an institution across a five-year period by the number of faculty members at that institution.

To account for the fact that different fields have very different publishing cultures – papers concerning the Life Sciences are responsible nearly half of all research citations as of 2015 – we normalize citations. This means that a citation received for a paper in Philosophy is measured differently to one received for a paper on Anatomy and Physiology, ensuring that, in evaluating an institution’s true research impact, both citations are given equal weight. The overall score is heavily influenced by the results of this metric, which is worth 20%.

It is an absolute fact that a world-class university gains and provides numerous advantages. With such entitlements, it attracts faculty from around the globe to visit and acquire a transfer of knowledge from one another. As a result, it could benefit both parties by strengthening their international branding and global outlook: primarily for institutions operating in an internationalised higher education sector. Furthermore, it provides a multinational workplace that allows faculty staff to exchange best practices and beliefs.

Therefore, the ratio of international faculty staff to overall staff is considered as one of the indicators. In order to calculate the number of the ratio, it requires faculty staff who are of foreign nationality who support academic teaching or research or both at a university. The minimum period that needs to meet is at least three months. This particular metric is worth 5% of the overall total.

Similar to International Faculty Ratio, a world-class university also plays an essential role in acquiring and providing benefits to international students. By inviting a large number of them, an institution or university might be able to benefit from networking, cultural exchange, an enhanced learning experience, and a diverse alumni community.

To measure this particular metric, it will total the number of undergraduate and postgraduate students who are foreign nationals. In terms of duration, they have to spend at least three months at the university or institution. This metric is also worth 5% of the overall number.

The International Research Network was initially introduced in the 2016/17 edition of the QS University Rankings: Latin America. As of the present time, it has now been broadened to all other regional rankings.

Additionally, the IRN Index is now included in the ranking of various subject areas such as Arts & Humanities, Engineering & Technology, Life Sciences & Medicine, Natural Sciences, and Social Sciences & Management.

Furthermore, the methodology of the IRN Index serves as the foundation for the “Knowledge Exchange: Progress/Dissemination” metric in the QS World University Rankings in Sustainability. The IRN is intended to encourage cross-border research collaboration and academic partnerships from across the globe.

The Margalef Index, commonly used in environmental sciences, has been adapted to measure the richness of international research partners for a specific institution. The IRN Index evaluates institutions’ ability to diversify their international research network by forming sustainable partnerships with other higher education institutions, taking into account the diversity of partner locations and the effort required to achieve such diversity. The QS International Research Network (IRN) Index is calculated using a specific formula:

IRN Index = L / ln(P),

where P represents the distinct number of international partners (higher education institutions) and L represents the distinct number of international locations represented by them.

In the QS World University Rankings and QS University Rankings by Region, this metric only takes into account sustained partnerships, which are defined as partnerships resulting in 3 or more joint papers with non-zero citations (excluding self-citations) indexed by Scopus in a five-year period.

The IRN Index is normalized by the five faculty areas, just as in other instances when citations and papers are processed. This means that the index is calculated for each faculty area and then averaged to ensure that the impact of different research publishing cultures is balanced across the various faculty areas. Moreover, only relevant paper types are taken into account and the usual affiliation cap is imposed. This metric carries a weight of 5% in the overall score.

A successful career is an essential goal for the majority of students who pursue their degree or education at a university. Therefore, an institution or a university has the responsibility for providing excellent education to potentially achieve good career outcomes and commitment of the institution to graduate success.

The Employment Outcomes indicator is designed to reveal how institutions manage to ensure a high level of employability for their graduates. In addition, it also examines whether or not institutions nurture future leaders that could potentially create an impact in their respective fields.

The data of this indicator will be gathered from institutions (employment rate) and the QS Alumni Outcomes dataset. With those data, it will be summed up by an aggregate measure that combines employment rate with a scaled score on the number of influential alumni on the QS Alumni Outcomes dataset. 5% of the overall score is determined by this particular metric.

Social and Environmental concerns are not simply tangential issues, yet rather are vital for achieving global progress. For this reason, it is believed that these concerns are important enough to be integrated into the QS flagship ranking.

It is the responsibility of universities and higher education institutions to address and contribute to the resolution of these issues. Not only does examine an institution’s commitment to sustainability, but also looks for tangible evidence of this commitment in areas such as the impact of alumni in addressing climate issues through science and technology, and the impact of research on the United Nations’ 17 sustainable development goals.

In addition, the ranking evaluates the social and environmental impact of universities as centers of education and research, as well as major employers and the operational sustainability challenges that arise in large and complex organizations.

The score of an institution, as determined by the methodology of the QS World University Rankings: Sustainability, forms the foundation of the institution’s ranking. It is important to note that this score is calculated from a larger sample size than the standalone ranking. This metric accounts for 15% of the total score

Achievements

Scan the code